It’s hard to believe, but November is already here—and Thanksgiving is just around the corner! As has become our tradition at this time of year, we’d like to give thanks for some of the PPC functions and tools that make our job much easier—and garners better results for our clients.

Therefore, here are (in no particular order) the tools and functions my team and I have particularly appreciated in 2017:
AdWords Labels
AdWords labels made the favorites of at least two team members: Alyssa MacPherson and Chelsea Tryon. What’s so great about AdWords labels? Well, for such a simple tool, they can be used in many, many valuable ways.
In fact, we get so excited about labels that I dedicated an entire blog post to them!
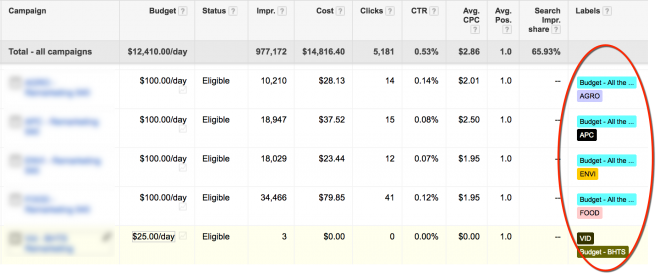
To give you just a few examples, you can use labels to monitor campaign budgets:
And ads:
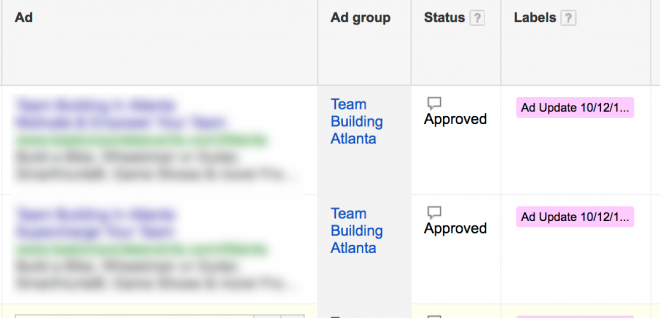
You can also use them to segment large accounts by ad update dates, campaign theme, manage underperforming (or top performing) campaigns and monitor keywords.
The possibilities are endless!
AdWords Extension Scheduling
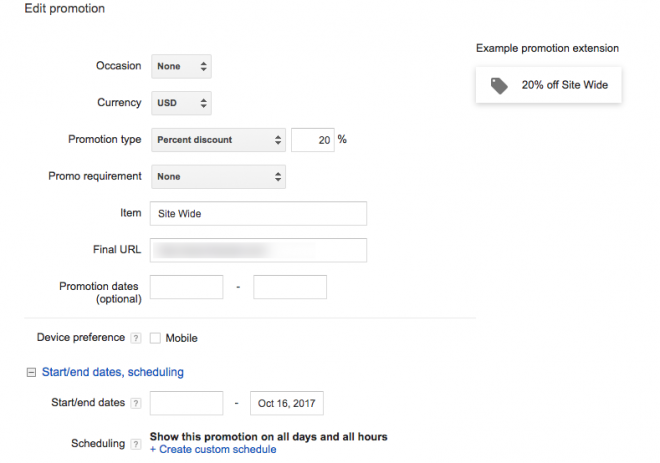
Extension scheduling is a favorite of team member Lori Iwanchuk. This capability allows us to set start and end dates for a variety of extensions.
For example, you can schedule start and end dates for promotion extensions:
For callout extensions:

And for sitelinks:

Could you imagine having to keep track of these start and end dates separately and then having to manually turn them on and off? Ugh! No thanks.
Segmenting by Conversion Type in AdWords Campaign View
Personally, I’m a big fan of having the ability to segment by conversion type in Campaign View:
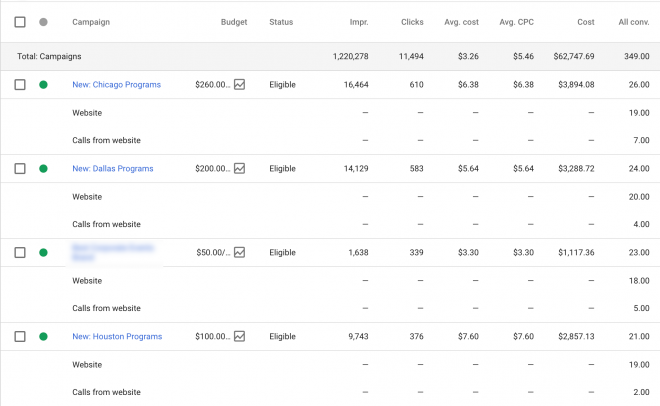
This view allows me to see which (and how many) conversions were from website lead forms and website calls—without having to navigate from screen to screen. It’s all here in one view!
Double Left Side Navigation in the New AdWords User Interface
Additionally, I’ve also developed a great affection for the double left side navigation bar in the new user interface:
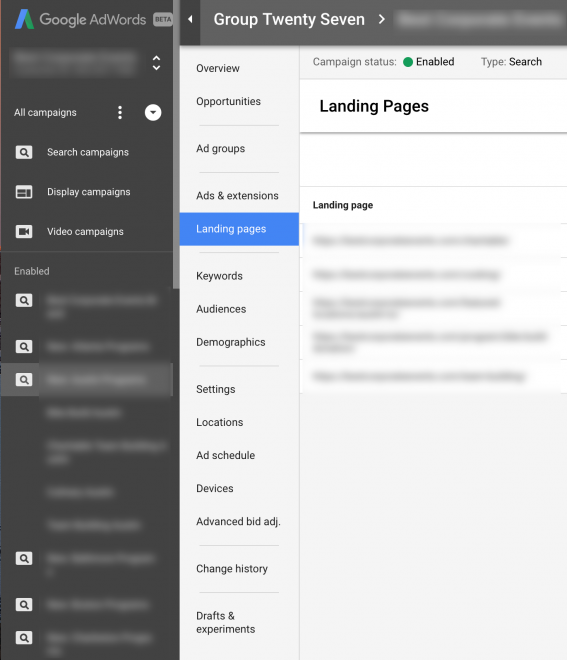
This double navigation bar allows me to view items at the campaign and ad group level much more quickly and easily than in the old UI. I also love the ability to view landing pages so easily.
In the past, I had to go through the Editor to view these things, which was a bit onerous. Being able to get the information I need—and fast!—is a mega bonus.
Non-Active Filter in the New AdWords User Interface
On the topic of the new user interface, Alyssa is a big proponent of the “All non-active campaigns” default filter:
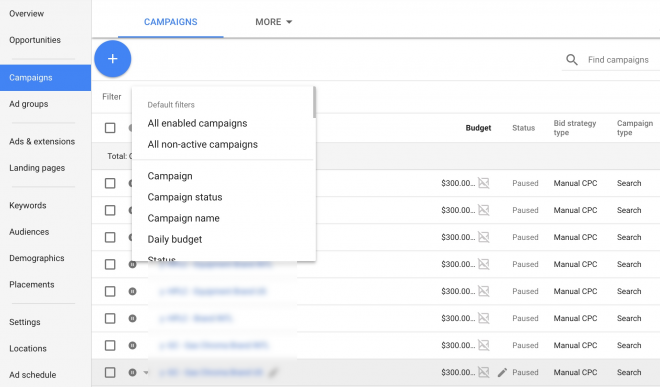
The “All enabled campaigns” filter has always been useful, especially when managing a long-standing account.
But the non-active filter is equally useful when clients have a bit of extra budget to put to work. With the non-active filter, she can quickly find all active campaigns that are currently paused and identify the best ones to reinstate.
The Google Analytics Customized Dashboard
Not all of our favorite features are found in AdWords. Many of them reside in Google Analytics!
Chelsea is a big fan of the customized dashboard in Google Analytics. She uses it to set up widgets that give her a snapshot of the data she checks most regularly. Typically, she’ll include things like revenue, transactions, goal completions, and campaign performance.
Here’s an example of one of her dashboards:
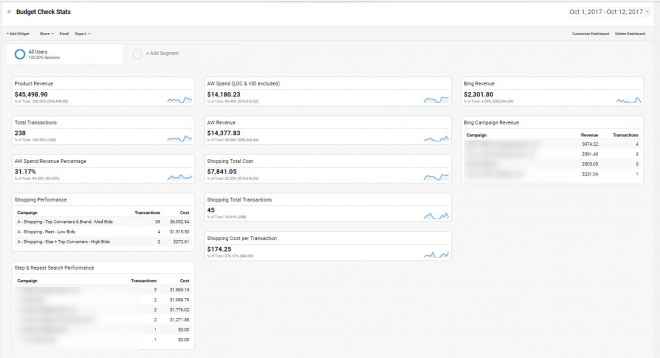
Having all her most important stats in one place saves her from having to navigate to five or six different pages to review performance. It also makes it easy to compare year-over-year data too.
Top Conversion Paths in Google Analytics
Chelsea also loves the top conversion paths function in Google Analytics:
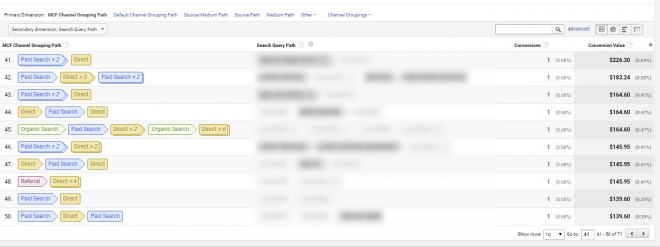
More and more, she’s been using this function it to find patterns and see how different channels and campaigns are working together.
Sometimes, she’ll add “Search Query Path” as her secondary dimension to see which search terms initiated a search, and which ones ultimately led to a sale or conversion.
Other times, she’ll use “Campaign (Or Source/Medium) Path” as the secondary dimension. Are users clicking on a search text ad first, then a shopping ad later? This is one way to find out.
Google Analytics Graphs
Also in Google Analytics, team member Lori recognizes how vital graphs are when interpreting data—and Google Analytics has no shortage of them! Nothing communicates year-over-year revenue performance, for example, more effectively than a visual representation. Columns of numbers in a spreadsheet simply can’t compare when you’re looking for trends.
Thank You!
While all of these functions and tools make our work easier, and I’m very grateful for them, what I’m most deeply grateful for this Thanksgiving are my wonderful clients and my amazing team.
My clients are a great inspiration to me. It’s a real honor to be invited inside your businesses and work alongside your marketing teams. I appreciate and greatly value the trust you put in me and my team.
As for my smart and dedicated team of PPC pros, I am truly blessed. Thank you for your creativity, commitment and excellent work. You’re a huge part of the success of this company. And I thank you for it.
And to my readers, I wish you all a relaxing Thanksgiving, filled with good food, peaceful moments and fun times.


